What is Meant by Contour?
“A contour is an imaginary line connecting various points of equal elevation from a specific data table. When this contour is depicted in a design, it is referred to as a contour line. Generally, a contour refers to a line that connects points of equal height or quality. In geography and mapping, contour lines are used to indicate the elevation and features of the terrain. For instance, in topographic maps, contour lines mark the characteristics of mountains, valleys, rivers, and other landforms. When the distance between contour lines is small, the area is steep; when the distance is greater, the area is smooth.”
What is Contouring?
Contouring refers to the process or technique used to create a contour map or contour design.
Contour Projection
Contour projection refers to the process of drawing contour lines of various values based on the proportional height of geographical points depicted in a design using an indirect method. Contour projection is a technique through which contour lines are transferred to a specific surface or map. This projection process is typically used in fields such as geography, topography, and architectural design.
Objectives of Contour Projection:
- Analysis of Terrain: Contour projection allows for the easy identification of the height, slope, and other characteristics of the terrain.
- Design Development: In architecture and engineering, contour projection is used to plan and design various projects.
- Mapping: During the design of maps, contour projection ensures the accurate representation of terrain features.
Methods of Projection:
- Branch or Parallel Projection: In this method, the contour lines are projected in parallel from a specific direction.
- Scientific Projection: This method is based on the coordination of height, lines, and points.
Results: Maps or designs obtained through contour projection provide a clear understanding of terrain features and assist in creating accurate plans

What Are the Characteristics of Contour Lines?
Contour lines follow certain rules, and their characteristics are described below:
- All points located on the same contour line have the same elevation.
- Two contour lines representing different elevations will never meet or overlap, except in the case of a vertical cliff sloping toward the sea.
- A contour line will either connect at its ends or extend beyond the edges of the map, but it will never terminate in the middle.
- The distance between contour lines increases inversely with the slope. Contour lines are closer together near mountain peaks, indicating steeper slopes, while they are farther apart at the base, reflecting gentler slopes compared to the summit.
- Contour lines spaced at equal intervals indicate flat terrain.
- A series of closed contour lines indicates hills or depressions, depending on whether the elevation values increase or decrease toward the centre.
- A series of contour lines directed toward the centre indicates a water divide or drainage, depending on whether the elevation values decrease or increase.
- Contour lines intersect valleys or ridges at right angles.
- Contour lines cannot be fragmented or broken.
- Contour lines are not drawn across rivers because river water is not stationary; instead, they are drawn along the riverbed or coastline.

What is Meant by Benchmark?
A benchmark refers to a specific reference point whose elevation or relative altitude is known. These are typically established in important locations. Generally, a benchmark signifies a specific standard, level, or point that is used as a basis for measurement. It has various applications in different fields. Here are some common uses of benchmarks:
- Geography and Construction: A benchmark is a point of known elevation that is typically used for mapping, construction work, or land surveying. It is usually established permanently and helps in determining other elevation points.
- Performance Measurement: In business and industry, benchmarks are used to determine an organisation’s performance, productivity, or service standards. In this context, it is compared with the average standards of other organisations or industries.
- Technology: Benchmark tests are conducted to assess the performance of software or hardware systems. This involves measuring the system’s effectiveness under various experimental conditions.
- Education: In education, benchmarks are used to assess the quality of students or educational programs. They help in determining the results of examinations or the standard of educational programs.
The purpose of using benchmarks is to set targets for development or improvement based on a specific standard or level.

How Many Types of Benchmarks Are There and What Are They?
Benchmarks can be classified into four types:
i. GTS Benchmark
ii. Permanent Benchmark
iii. Temporary Benchmark
iv. Designated Benchmark
Contour Lines
Contour lines refer to the imaginary lines that connect various points of equal elevation on the surface of the earth. These lines represent a specific height level and are the most accurate means of depicting relief. For this reason, this method is commonly used. Contour lines not only provide a relative understanding of the area’s topography but also supply accurate and precise information about the elevation of the land surface.
How is a Contour Map Prepared? What are its Characteristics?
A contour map is created by drawing contour lines that connect contour points (points situated on the contour on the ground). In other words, a map that contains contour lines is referred to as a contour map. The elevation of various contour points is written alongside the contour lines.
By reviewing a contour map, one can gain a comprehensive understanding of the characteristics of a large area, such as mountains, mountain passes, the nature of valleys, steepness, ruggedness, low-lying areas, rivers, etc. Contour lines are generally drawn at equal vertical intervals.
The Main Features of Contour Mapping:
- Data Collection: The first step in creating a contour map is gatheringinformation about the height of the terrain and its geographical features. This is done through field surveys, height measurements, and geological data.
- Point Mapping: After collecting data at various points (according to height and local features), the elevation for each point is determined.
- Drawing Contour Lines: Contour lines are drawn by connecting points of equal elevation. Typically, these contour lines are drawn at a specific interval (such as 5 metres or 10 metres).
- Finalisation: After drawing the contour lines, the map is refined. Additional information such as rivers, roads, and other geographical features is added.
- Printing and Publication: Finally, the contour map is either printed or published in digital form.
Significance of Contour Maps:
- Analysis of Terrain: Contour maps help in easily analysing the characteristics of the terrain. They assist in identifying mountains, valleys, rivers, and other features.
- Planning of Development: They play an important role in urban development, agriculture, and transportation planning.
- Educational Purposes: Contour maps are used in geography education and research, helping students understand geographical features.
- Construction and Engineering: Contour maps are utilised in construction projects for land planning and architectural design.
- Visibility: Contour maps visually represent changes in elevation, making it easier for users to understand the information.

Write the full form?
H.F.L = Highest Flood Level
B.M= Bench mark
F.L-Formation Level
M.S.L Mean Sea Level
G.T.S =Great Trigonometrical Survey
R.L = Reduced Level
T.B.M= Temporary Bench Mark
What is a Contour Survey?
A contour survey is a specialised survey method used for analysing the elevation and structure of the terrain. In this survey, contour lines are created to identify various geographical features such as mountains, valleys, rivers, and other land formations.
Process of Contour Survey:
- Data Collection: The first step in a contour survey is to collect information about the terrain. This information typically includes data about elevation, land structure, and other characteristics. It is gathered through field surveys, GPS, and other technologies.
- Determining Contour Points: During the survey, elevations are determined at various points. These points are usually at equal elevation levels.
- Drawing Contour Lines: Contour lines are drawn by connecting points of equal elevation. These lines represent the height and slope of the terrain.
- Creating Maps: A contour map is generated based on the contour lines, which accurately represents the local geography.

Characteristics of Contours
Contours or contour lines have several features that aid in analysing the elevation and structure of the terrain. Here are the main characteristics of contours:
- Equal Elevation: Contour lines connect points of equal elevation, meaning each point on the contour line indicates the same height.
- Parallelism: Contour lines are generally parallel to each other. When two contour lines are close together, it indicates a steep area, while a wider distance suggests a smoother area.
- Angles and Curvature: The bends and angles of contour lines indicate the structure and slope of the terrain. Areas that create curved contour lines typically signify sloping and complex land formations.
- Proportional Distance: Changes in the distance between contour lines indicate changes in the terrain and slope. For instance, if the distance between contour lines is small, it suggests a steeper area, while a larger distance indicates a smoother area.
- River and Waterbody Indication: Contour lines indicate the location of rivers and water bodies. Typically, contour lines bend toward rivers, which indicates the direction of water flow.
- Elevation Indication: Contour maps usually include elevation values next to the contour lines, providing users with an understanding of the elevations represented by the contours.
- Local Features: Contour lines also mark the positions of other geographical features such as hills, valleys, and plains.
Conclusion
Contour surveys and their characteristics play a vital role in the accurate analysis and research of terrain. Contour maps are used in geography, architecture, and engineering, aiding in project design and development.

Uses of Contour Survey
Contour surveys have two types of applications:
(a) Engineering Uses:
- It helps in selecting suitable and convenient locations for implementing engineering projects such as roads, railways, canals, water supply systems, pipelines, dams, and drainage systems.
- It determines the amount of earth to be filled or excavated.
- It aids engineers in establishing profiles along any direction of a country or area.
- Contour surveys are extensively used for planning drainage or catchment areas and determining the capacity of impounded reservoirs.
- It provides insights on how to avoid cutting precious soil.
- It is effective in identifying routes along a specific slope on contour maps.
- Drawing from a contour map is straightforward.
- It assists in construction and determining the depth of foundations.
(b) General Uses:
- With the help of contour maps, one gains comprehensive knowledge about the general characteristics of an area.
- From a contour map, one can acquire knowledge about the relative height above the earth’s surface or a point below it.
- It helps in determining the insights between two points.
- A distinctive feature of contour maps is that they are three-dimensional. In fact, any significant project relies on a contour map.
Furthermore, with continuous support from professionals, we offer a comprehensive array of contour survey services tailored to our clients’ needs. In addition to this, by utilising modern technologies and equipment, we create plans for our customers.

Our Service Area for Contour Line Preparation
In addition, we provide a wide range of digital land surveying and mapping services. Similarly, we conduct topographic surveys, auto-levelling, contouring, road, highway, pipeline, and canal route studies, site plan preparation, hydrographic surveys, reservoir studies, river studies, inundation mapping studies, and network method traversing adjustments using GPS technology.
We offer comprehensive and excellent solutions in the form of contour surveys. Furthermore, we maintain international standards and provide engineering companies with essential contour and alignment surveys. Specifically, we ensure smooth execution of our services with the help of our CAD designs and conventional drawings.
We are one of the renowned companies in this field. Additionally, we offer extensive land surveying services for our valued clients. Our professionals work diligently to deliver the best service within the promised time frame. Notably, we consistently meet our clients’ accuracy requirements. We guarantee 100% quality and build reliability.
With an impressive growth record in this industry, we are always ready to provide any type of land surveying service.

What is meant by Contour Interval and Horizontal Equivalent? What factors does the
The vertical distance between two successive contour lines is called the contour interval. Once set, the contour interval remains consistent throughout the entire survey. The horizontal distance between two consecutive contour lines, determined by the slope variation, is called the horizontal equivalent. The value of the horizontal equivalent changes depending on the slope; it is not uniform across all areas.
The contour interval depends on the following factors:
- The topography of the surveyed area, whether it is flat, elevated, depressed, or sloped.
- The purpose and scope of the survey.
- The scale of the map.
- The time and budget allocated for the survey.
- The level of precision required. If the terrain is more rugged, the contour interval will be larger; if the terrain is smoother, the interval will be smaller. Similarly, for smaller map scales, the contour interval will be larger, and for larger map scales, the interval will be smaller.
For most engineering works, the contour interval is set at 2-3 metres (5-10 feet), for mountainous areas it is set at 20-30 metres (50-100 feet), and for residential development, it is typically 0.25-0.5 metres (1-2 feet).

How to establish a grade contour in the field?
During the preliminary survey for the construction of roads or railways in hilly areas, it is necessary to establish various points along a specified slope. The line connecting these points is called the grade contour. It is initially set approximately using an Abney level and later adjusted accurately using a levelling instrument.
1. Using the Abney Level: The vernier of the Abney level is set to the reading corresponding to the specified slope. The instrument is placed on a holder or pole at the starting point at a fixed height (1.5 metres). The next point, 30 or 40 metres away, is adjusted up, down, or sideways so that the vane or line of sight intersects it at the same height (1.5 metres), and the bubble is centred. The line connecting the instrument station (first point) and the staff station (second point) will be parallel to the line of sight and will follow the given slope. A pole is placed at this second point. The instrument is then moved from the first point to the second, and the same process is followed for marking additional points. However, this method is not very precise.
2. Using a Levelling Instrument: In this method, the distance to the next point from the first or previous point is measured. Using this distance, the given slope, and the height of the instrument, the required staff reading for the next point is calculated. For example, if a downward slope (1:420) needs to be marked, and the R.L. of the first point is 500 metres, with a distance of 40 metres between the first and second points, and the instrument height is 502.45 metres, then the staff reading for the second point is calculated accordingly.

How to design a drainage project using a contour map?
(a) Determining the amount of drainage: The amount of drainage depends on the area of the drainage basin. If the drainage area is large, the drainage quantity will be higher, and if it is smaller, the drainage quantity will be lower. To determine this, the watershed boundary is drawn on the contour map, and the area enclosed within the watershed is measured using a planimeter. While drawing the watershed boundary, it is important to ensure that the slopes on both sides of the boundary slope downward.
(b) Determining the drainage channel path: The highest and lowest points on the map must be identified. The drainage channel path should be determined in a way that ensures it follows the necessary slope and remains as straight as possible. Placing the drainage channel across the contour lines will result in the steepest slope, but care must be taken to ensure that the minimum slope does not fall below 1:4800.

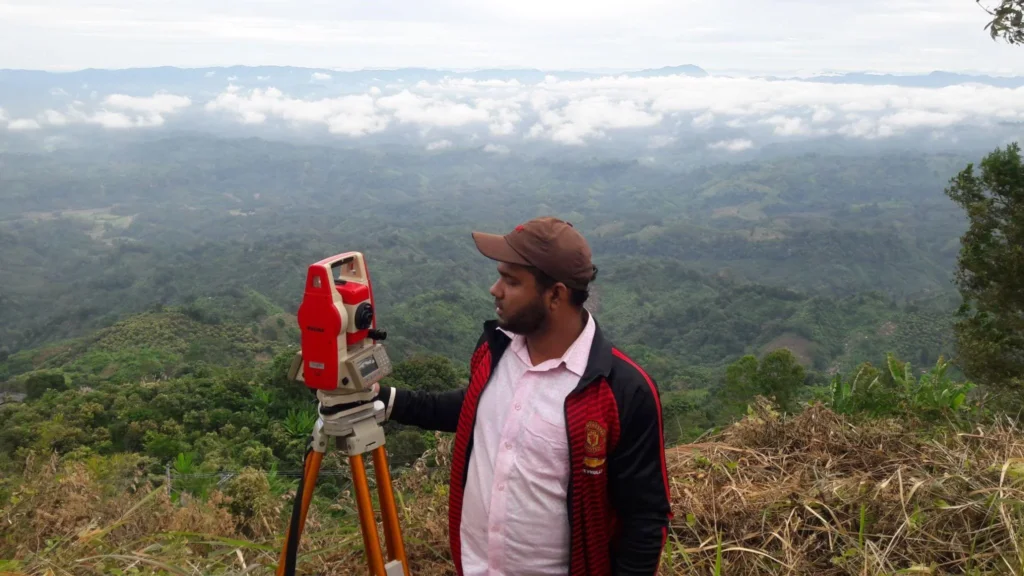
What is meant by Trigonometric Levelling?
Where and why is it used?
Trigonometric levelling is an indirect levelling method in which a theodolite is used instead of a levelling instrument. In this method, the vertical angle is measured with the theodolite, and the horizontal distance is measured or calculated using a chain or tape. By doing this, the relative height or elevation of a tall object or point is determined. This method is typically applied in hilly or mountainous areas where traditional levelling is difficult to carry out.
Applications of Trigonometric Levelling:
- Distance Measurement: This method generally involves measuring distances and angles, which helps determine elevation using trigonometric formulas.
- Analysis of Terrain: Trigonometric levelling is used to determine the heights of mountains, rivers, and other geographical features.
- Construction Projects: During construction work, this method aids in accurately determining the elevation of various locations, which is essential for establishing correct foundations and other construction plans.
- Map Creation: Trigonometric levelling is used in the creation of geography and topography maps to identify various terrain features.
Reasons for Use:
- Accuracy: Trigonometric levelling is a highly accurate method that helps precisely measure the elevation of distant points.
- Accessibility: In some areas, direct levelling may be difficult, making trigonometric levelling a convenient alternative.
- Speed of Measurement: It allows for relatively fast and effective measurement of distances and heights.
Method:
Typically, a theodolite or transit is used for trigonometric levelling. It measures angles and distances between one point and another, and elevation is determined using trigonometric formulas.
Thus, trigonometric levelling is an important method used in various engineering and geographical applications.
Conclusion
As you stand atop a hill, gazing out at the undulating landscape, you’re reminded of the ancient Greek myth of Daedalus, who mastered the art of traversing complex labyrinths.
Similarly, a contour survey is your map, guiding you through the twists and turns of the terrain.
With its precise measurements and intricate lines, it’s your key to deciphering the secrets of the land, ensuring your construction projects are built on solid ground.
For a professional and accurate contour survey, call Sonar Bangla Survey Consultants office at +880 1742 585592 to get a free quotation from a team with a proven track record of excellence, boasting over 150 5-star reviews on Google.